
Vertical analysis

Vertical analysis is a financial analysis technique that allows knowing the percentage weight of each item in the financial statements of a company in a given period of time.
It is also called structural analysis, of the financial statements or one hundred base percentage. Its concept is simple, percentages are calculated on total values. In this way, we know the weight that each part has in the whole. For example, if we have total assets worth one million dollars and tangible assets worth 700,000, the percentage that these represent of the total is 70%. Later we will see it in an example.
How the vertical analysis is performed
The process can be done with a spreadsheet. What we do is divide each game that we want to analyze by the total of the group to which it belongs and multiply by one hundred. Normally the items belonging to the patrimonial groups are used in the numerator and in the denominator the so-called patrimonial masses. The formula could be this:
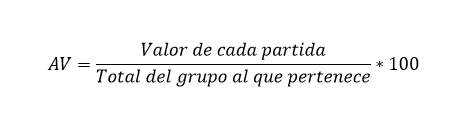
This technique allows us to verify the economic and financial situation and the income statement and make comparisons with other companies in the same economic sector. On the one hand, it informs us about the weight of each part and, on the other, it allows us to check if we are in the sector average (which is desirable) or not.
Considerations of hundred-based percent analysis
This analysis can be done on the balance sheet or on the income statement. The process is similar in both cases, as we will see in the example. Although we must take into account the sector in which we operate, some considerations could be the following:
Regarding the balance
- We can know if the company has more fixed assets (non-current) or on the contrary it has a greater working capital (current assets). Both calculated on the total of your assets on the balance sheet.
- The same can be said of your liabilities or debts. That is, if the proportion of long-term debts (non-current liabilities) is greater than that of short-term debts (current liabilities). All this on the total of the payable liabilities.
- When analyzing the net worth, it can be verified which items are more significant. If the reserves, the capital, the subsidies, and so on.
- Know if it is financed mainly with own resources or others. The analysis would be calculating the percentages of net worth and liabilities due on the total.
In relation to the income statement
A similar analysis can be done with the income statement. In this way, each game will be divided by the total of the group that we want to analyze. Some possible considerations would be the following:
- You can find out which is the most significant operating cost. For this, the percentage of each item of expenses over income is calculated.
- On the other hand, related to the previous one, the percentage of purchases over sales or income can be calculated. In commercial companies this point is very important, since they buy to sell without transformation.
- You can calculate the total cost (excluding financial expenses) on the income.
- We can calculate what is the percentage of financial expense over the total financial result. This information is important for financial efficiency.
Vertical analysis example
Let's finish with an example. These analyzes can be done with a spreadsheet, although many management programs usually include them. Let's imagine a company with a balance sheet like the one shown. We will focus only on the current year and will dispense with the income statement. The last column in both cases is the vertical analysis.
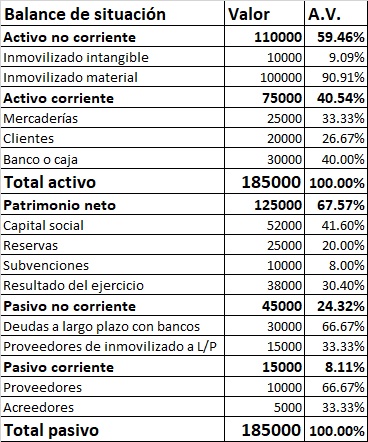
We can see that non-current assets account for 60% of total assets, higher than current. Customers account for just over 25% of total current assets. The treasury has an important weight (40%), therefore, it does not seem that there are liquidity problems. Regarding liabilities, we can highlight that the result for the year is more than 30% of the net worth or that long-term debts are the ones that carry the greatest weight.
Of course, this vertical analysis must be complemented with others such as horizontal analysis. It is also convenient to calculate the so-called accounting ratios. The latter will provide us with information regarding solvency or liquidity, among others. Once all these calculations have been made, a financial economic report of the company can be issued.
Leave a Reply