
Horizontal analysis

The horizontal analysis calculates the absolute and relative variation suffered by each of the items on the balance sheet or the income statement in two consecutive periods of time.
Therefore, the horizontal or dynamic analysis focuses on finding out what has happened to an accounting item in a given period. It is normally calculated between two financial years and in the calendar year. It must be taken into account that absolute and relative values are used, the latter being the most useful to show the variations.
How to do a horizontal analysis
The way of calculation is very simple. We need the balance sheet or income statement for two years. In this way, in a spreadsheet or using specific software, two more columns are added. The first is the difference between the last year and the previous one. The second is a rate of change whose formula is the following:
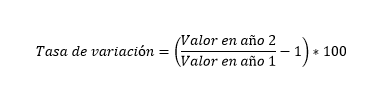
What the rate of change (relative value) does is calculate how much a variable increases or decreases in two periods of time. The value obtained indicates in percentage what this variation has been. The sign tells us if it has increased (positive) or decreased (negative). This value is the most relevant in the analysis.
Some considerations
When carrying out the calculations, we must take into account which games we are comparing. It is not the same to compare debts and fixed assets. In the first case, the ideal state is that these decrease. In the second, depending on other factors, it could be that it increases. In relation to expenses and income, a similar reasoning could be made.
On the other hand, comparison with the sector average is also necessary. There are items that grow little in percentage terms, but it is a characteristic of a specific activity. For example, in the case of banks, interest rates vary little from year to year. Therefore, it is convenient to know how others behave.
A practical example
Let's imagine a company that has an income statement like the one shown. We will dispense with the balance. We have two columns with the values of the last two years. A third column indicates the absolute variation and the fourth the relative one. We have seen the formula for the latter in a previous section.

We can see that revenues have increased by 20,000, which is 20% over the previous year. Supplies also had an increase, while the rest of expenses decreased. The financial result improved by increasing income and reducing spending. We see that, in this case, the variation is negative, because we started from a negative value. Therefore it is interpreted as a decrease. The overall result increased by almost 50%.
The usefulness of horizontal analysis has become clear, but yes, it cannot be done alone. It must be completed with others such as the vertical or the ratios. Ultimately, a company is a complex whole and for that reason it must be analyzed from various points of view.
Leave a Reply