
Sensitivity analysis

Sensitivity analysis is a technique that studies the impact they have on a dependent variable of a financial model the variations in one of the independent variables that make it up.
Simply explained, what we do is observe how an increase or decrease in the value of a factor affects the final result in a financial analysis. For example, if we are using the net present value (NPV) we might be interested in what would happen in this value if the initial investment required for a project increased.
How is the sensitivity analysis performed?
To perform a sensitivity analysis, focused on financial aspects, the cash flows and NPV of an investment are calculated. We then vary one of the factors, such as sales, costs, or anything else, and see what happens to the new NPV. Then you just have to calculate the variation in percentage from one to the other. The formula could be this that we show you below:
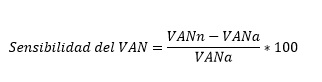
First, options are raised based on possible future scenarios. These are analyzed with the data that we know and those that will change. Once we are clear about each of them, we can compare them and make decisions about whether we are interested in modifying these factors. These are usually related to production, costs or sales.
Advantages and disadvantages
- The main advantages are that it is easy to apply and understand. We are facing percentage variations that allow a simple understanding of the different situations that occur.
- The drawbacks are, above all, that it studies the changes of a single variable at a time. On the other hand, it does not use probability distributions in NPV or IRR analysis, something that scenario analysis does. This greatly limits the predictive ability of this technique.
Let's see an example
The analysis can be done with a spreadsheet. The investment in the example is new machinery. Cash flows represent the two options, NPVa and NPVn. The differences between the cash flows are given by variations in sales due to two possible scenarios, for example, depending on an advertising campaign.
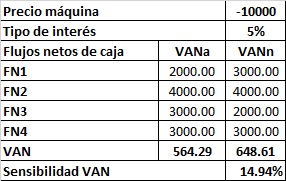
We can see that in the first case the NPV is 564.29 monetary units (CU) in the second it is 648.61 CU. Therefore, the sensitivity of NPV is 14.94% and positive. Given these changes in sales, there would be an increase in NPV of almost 15%. Therefore, it seems that this campaign can be effective.
Leave a Reply