
Phillips curve

What is the Phillips curve?
The Phillips curve is a curve with a negative slope, which indicates the relationship between the unemployment rate Y inflation. This exposes that an increase in unemployment considerably reduces inflation and vice versa. This theory was published by William Phillips in 1958.
In other words, the Phillips curve shows that low inflation is not possible if the employment rate is high. His explanation is that the greater the aggregate demand generated by more employment and movement in the economy, the greater the tension in prices, because they will rise.
The Phillips curve serves as an indicator, since it suggests that there must be a certain rate of inflation for unemployment to be minimized.
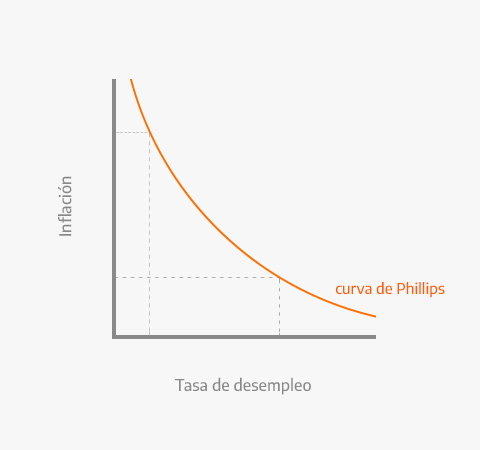
Phillips curve graph.
It should be noted that if said representation is studied at short term, could present the following scenario: As the demand for a company's goods and services increases, it must also increase its production, so you will need hire more staff and thus reduce unemployment.
Given this situation, the company's supply will be less than consumer demand, which will automatically generate the increase in the price of the good, that is, higher inflation, since the consumer will have to pay more for the good or service.
Long-term Phillips curve
However, the Phillips curve is also studied at long term, and there it presents a different panorama to the previous one.
If the government were to bet on lowering the unemployment rate and yielding to inflation, it can do so in the short term, but in the long run inflation will return to its previous level, since supply and demand tend to adjust to each other.
For example, if applying an expansionary monetary policy were to generate more employment and lower the rate, inflation would increase and in a matter of time the real wage would be adjusted. However, after a while, said salary would return to the same real value as before and now it would be necessary to adjust it again, because the market adjusted to the new value.
According to various economists, in the long run the unemployment rate always tends to be close to a 'natural rate of unemployment', thus as the salary adjusts to the real value, the level of inflation will gradually exceed the level of unemployment, so the Phillips curve would not make sense.
Because of this, the long-term Phillips curve is usually plotted vertically.
In conclusion, it is possible to say that the Phillips curve is only feasible to explain variations in inflation and unemployment in the short term.
Leave a Reply