
Dupont analysis

The Dupont analysis is an important tool to identify if the company is using its resources efficiently. This methodology requires data on sales, net profit, assets and the level of indebtedness.
The objective of the Dupont is to find out how the profits (or losses) are being generated. In this way, the company will be able to recognize what factors are sustaining (or affecting) its activity.
The formula for the Dupont analysis is as follows:

Net profit is also known as net profit.
As we can see, through this instrument, the financial profitability or ROE is analyzed, separating it into three ratios.
Elements of the Dupont analysis
The elements of the Dupont analysis are as follows:
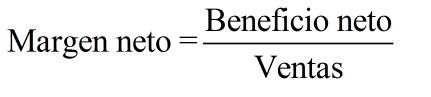
- Net margin: It is the percentage of profit that is achieved on average for each sale. It is calculated by dividing net profit (net profit) by sales. This, after discounting all costs.
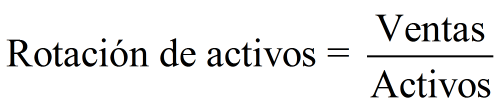
- Asset turnover: It is explained as the number of times per year that assets were rotated in order to obtain income. Another interpretation of this ratio is the number of monetary units (dollars, euros, etc.) that were received in sales for each monetary unit invested in assets. If the company has been increasing this indicator, it means that it is being more efficient in managing its resources.
- Capital multiplier: It reflects the financial leverage of the company. It is interpreted as the number of monetary units of assets that were acquired for each monetary unit contributed by the shareholders. If the ratio is equal to 1, it means that the organization has only been financed with its own resources. On the other hand, if it is greater than 1, debt has been requested from third parties, for example, the bank.

It should be noted that by multiplying the net margin by the asset turnover, the result is equal to the return on assets or ROA. In this way, the Dupont analysis is divided into two components: One related to operational efficiency (ROA), which indicates how productive the company's processes are, and another linked to the level of leverage (Capital multiplier).
This means that financial profitability (ROE) is equal to economic profitability (ROA) multiplied by financial leverage:
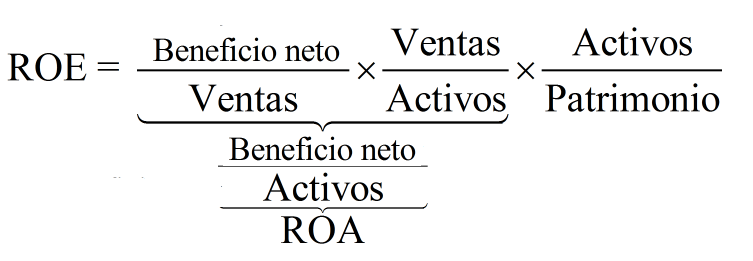
We can break down the Dupont analysis from this other perspective as well:
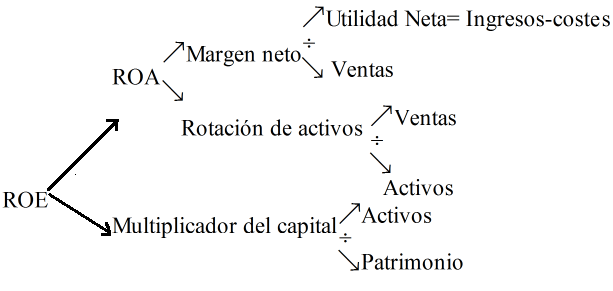
The table shows the sources of financial profitability in more detail. In addition, it is clear what data is required from the income statement. These are income and expenses (sales costs, administrative expenses, financial expenses, among others), while assets and equity are part of the company's balance sheet.
Usefulness of Dupont analysis
The main utility of Dupont analysis is that it allows you to make decisions in order to increase financial profitability. To achieve that goal, it is crucial to identify the areas where the company needs to improve its operations.
For example, if administrative expenses increase due to an increase in electricity rates, this will affect the net profit. In turn, the net margin and, consequently, the ROA will be reduced. Then, steps can be taken to save on electricity use in the office. As a result, ROE will go up.
Dupont analysis provides an idea of the evolution of the business over time, if historical data is considered. In addition, it allows you to simulate the impact of certain actions in different scenarios.
For example, the impact of an increase in the level of leverage of the company for the acquisition of new machinery can be evaluated. This would increase the assets, but also the financial expenses for the payment of interest.
Dupont analysis example
Suppose that in 2017 a company made a net profit of US $ 200 and the income (excluding VAT) was US $ 2,000. Likewise, assets came to US $ 1,500 and liabilities to US $ 900.
With the information provided, we can calculate each element that makes up the financial profitability:
Net margin: 200 / 2,000 = 10%
Asset turnover: 2,000 / 1,500 = 1.33
Equity: 1,500-900 = 600
Capital multiplier: 1,500 / 600 = 2.5
So the SWR is 0.1 * 1.33 * 2.5 = 0.33
In the example, the capital multiplier can be identified as a particular strength. In other words, the level of indebtedness of the firm is not dangerous. However, the profit margin on sales could be improved.
Extended version of the Dupont analysis
An extended version of the Dupont analysis allows it to be broken down into five ratios as shown below:

Where:
BAT = Profit before taxes
BAIT = Profit before interest and taxes
So, we can identify four elements:
- Net profit / BAT: Called tax effect. Indicate how many units of net profit are left for each unit of profit before taxes. In other words, it measures the impact of paying taxes on the company's profits.
- Assets / Equity * BAT / BAIT: Reflects financial leverage. If your result is greater than 1, the debt is increasing the ROE. On the other hand, if it is less than 1, the consequences of the credit are negative for the benefit of the company. If it is equal to 1, there is no repercussion.
- BAIT / Sales: It is the EBIT Margin or BAIT Margin that measures the profitability obtained before the payment of interest and taxes. It is also known as operating margin.
- Sales / Assets: Asset turnover
In this broader version of the Dupont analysis, it is clearer how an increase in taxes impacts, for example. If the government raises the tax rate for companies, the net profit decreases, lowering the tax effect ratio. Consequently, the ROE is reduced.
Leave a Reply