
Chart analysis
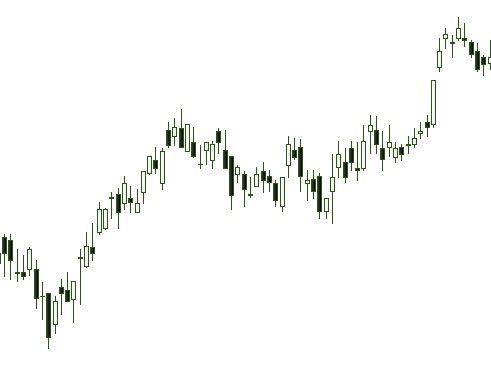
Chart analysis is the branch of technical analysis that studies the patterns that are formed in stock prices. The word chartist is an Anglicism from the word chart, which means graph.
The chart analysis was born around the year 1930 from the hand of Dow Jones. The first chartist theory that existed and is, in fact, studied is the Dow theory. Since it was born, research in this field has proliferated. Later, thanks to technology, technical indicators would appear on the scene. The chart figures, together with the stock market indicators, form the technical analysis.
Main chartist figures
Chartist figures can be classified based on two criteria. First, according to its implications. And second, according to its complexity. According to its implication depending on whether the pattern indicates the end of the trend, continuation or not necessarily any of the previous ones. And according to its complexity if the pattern is formed in a few periods or in many periods. This last classification differentiates the patterns that will be discussed below and the Japanese candlestick patterns.
Trend depletion figures
They are figures that indicate a possible end of the current trend and, therefore, the beginning of the opposite trend.
Trend Continuation Figures
They are patterns that indicate that the continuation of the current trend is most likely.
Other formations
They are patterns that do not necessarily have an implication.
Chart analysis vs technical indicators
Chart analysis and technical indicators form what is known as technical analysis. It cannot be said that one type of analysis is better than another. Both types of analysis are valid. Depending on the characteristics of each trader, one or the other will be more recommended.
In any case, it is easier to check whether a trading system works, in the case where technical indicators are used. This is so, because technical indicators constitute the quantitative part of technical analysis. To put it in some way, chart analysis is more subjective and technical indicators more objective. Which does not mean that technical indicators also present problems of subjectivity when interpreting them. In fact, some technical indicators contradict each other at certain times.
However, they are not incompatible. So much so, that some analysts use technical indicators to confirm chart patterns. And vice versa, others use chart figures to confirm the patterns drawn by technical indicators.
Leave a Reply